To empower educators and education leaders to proactively support students in diverse learning settings, Education Insights provides real time analytics on student engagement, learning progress and wellbeing. Learning progress data in Insights’ Assignments and grades report just got richer, more informative, and easier to use.
With the release of the new assignments and grades report for Educators, you get:
- More data – access and interpret consolidated data on progress status, grade trends, categories, group assignment information, and coming soon, rubrics and resource usage data
- More granularity– drill down from the class overview to see data specific to a single student or assignment, and comparisons to the whole class
- Improved and actionable experience – Use color coding to scan for student needs and communicate directly with students
With more information in context, Education Insights is built to save you time by presenting data that you can process and convert to effective teaching with ease.
Key insights unlocked by the new report
The new assignments and grades report draws awareness to key factors of student success, so you can support students exactly where they need it most. To help you get started, we’ve collected a few key examples of what educators can learn about their class.
Are my students managing their time effectively?
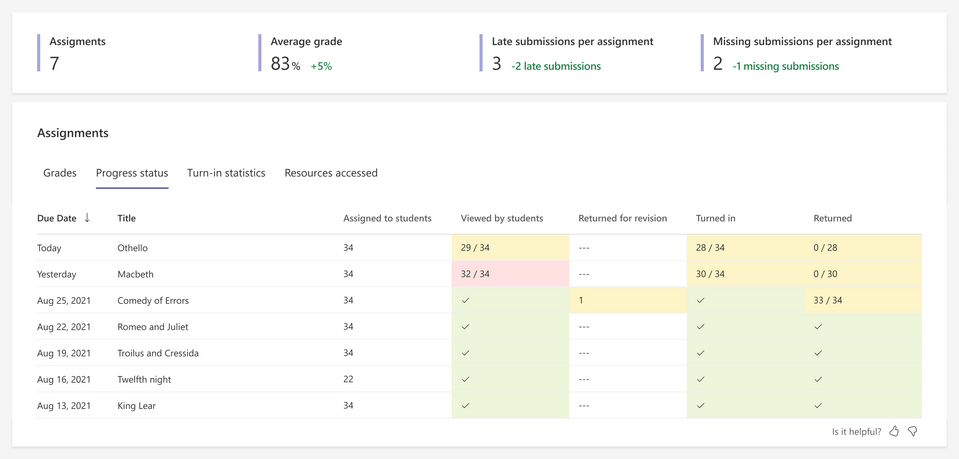
Educators often request information on students’ progress towards assignment completion. With information on which step students are on, educators estimate the workload of the class, reach out to students that are procrastinating, and offer timely support. With visuals that make it easy to compare student progress on different assignments, educators can reflect on the variations in student success across types of assignments. For example, how are students managing their time in group assignments versus individual projects?
In the new report top-level data provides an overview of the trends in your class, as well as a detailed data on the progress per assignment; Who has already viewed the content? Who turned it in? Who needs to revise it? Color coding helps to easily identify where attention is needed. For example, if an assignment is due tomorrow but some students have not viewed or turned it in yet, it will be shown in yellow. Any yellow or red segment of the chart is actionable, selecting a segment opens a list of students who you can reach out to support – simply select their name and begin a chat.
Which assignments do I need to grade?
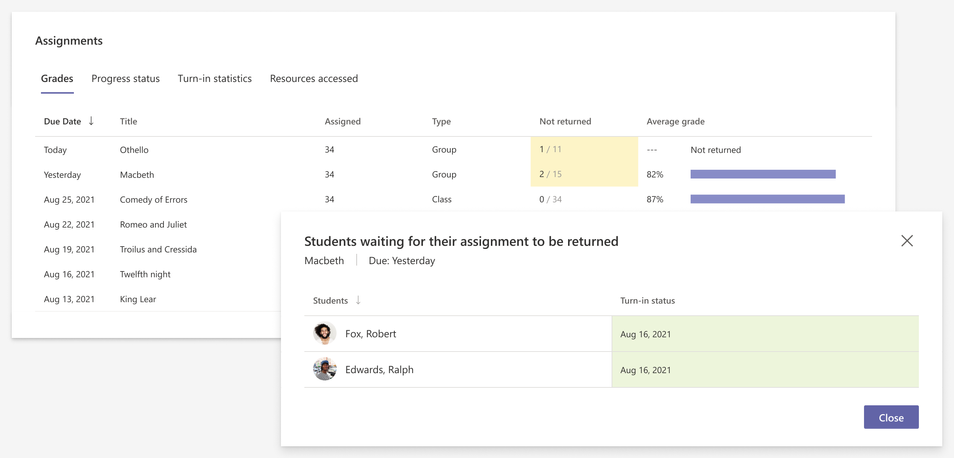
Educators want to review, provide feedback, and return assignments to students in a timely manner. From the Assignments panel, you can see which assignments are ready to grade. Once the assignment due date has passed, it will be differentiated from upcoming assignments in yellow, helping to easily focus your energy. s=Select any yellow segment to view a list of submissions that need graded.
How effective is my teaching? Was a specific topic especially challenging?
Responsive educators are dedicated to adapting their teaching to support their students. Data on student performance can help educators identify where their teaching was impactful, and where students could use more support. What’s working for most of the class may not be the right approach for specific students, that’s why Insights provides views on the whole class’s average growth, as well as the ability to view each student’s trajectory as compared to the class average. In the Grades panel you can now get insight into how the overall class is doing, or filter to focus on individual students and identify who needs additional attention, whether they are struggling or need to be challenged to continue to grow.
How is a specific student doing overall in my class?
Educators build relationships with students and often know which students could benefit from additional attention. Insights can support educators in tracking students they are concerned about, noticing students who haven’t outwardly indicated their need for support, and simply for preparing for parent-teacher conferences.
With the Student list at the bottom of the Assignments and Grades report, you get a granular list of all your students: their assignments, progress status, grades and feedback. With color coding to easily spot if anything I overdue, missing, or returned for revision. This visual helps identify student trends, and each student’s name is actionable, select a student’s name to dive into their full assignments report or start a conversation.
Once you drill into a whole report focused on the specific student; you’ll see even more information including specific textual feedback, how they are doing compared to the class and their group in different assignment types, how frequently they are asked to revise an assignment and more.
How do students perform on a category of assignments?
Filter by category to identify which types of assignments students are most successful at and those that you may want to adjust. Using categories such as essays, homework, or quizzes can help inform your teaching practice or differentiate for student success, or use it to track learning units out of the learning standards of the specific class
Want to give it a try now?
Of course, you do!
Navigate to any class in Teams and select the Insights tab, then select assignments report to get all that important information on your students learning progress today.
What can I look forward to with Insights for Assignments?
The Insights team is working to provide more data views for educators. check out what we have planned for release just in time for the 2022-2023 school year.
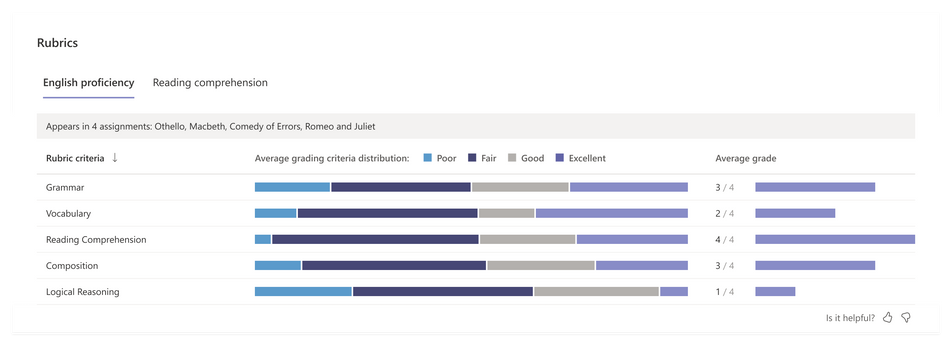
Rubrics (by Q3) – If you use rubrics in your classroom, including them in your assignments in Teams will now connect to Insights! Visual breakdowns of your grading will help identify topics to re-teach and areas for celebration!
Resource usage data (by Q4) – Educators frequently attach various resources for students to engage with as they complete an assignment. The Resources accessed tab will help educators view which resources are being accessed by students. Educators can then assess the usefulness and clarity of the resources or encourage students to engage with them.
Have feedback? Please share it with us!
We’re always looking for ways to make Education Insights and Reflect better. Have questions, comments, or ideas? Let me know! Add your ideas here or share your comment below.
Resources
- Learn about Education Insights
- Learn about Assignments Services
- Free course: Getting started with Education Insights
- Free course: getting started with Assignment Services
- How to use the assignments and grades report
https://techcommunity.microsoft.com/t5/education-blog/anchor-your-teaching-strategies-in-data-new-assignments-and/ba-p/3528983 https://techcommunity.microsoft.com/t5/education-blog/anchor-your-teaching-strategies-in-data-new-assignments-and/ba-p/3528983 2022-06-22 14:03:07Z


